The Market Everyone Is Misreading: UAE Real Estate at Day 16

Dubai, UAE
Newsletter 03
EDITORIAL
On February 28, 2026, the UAE found itself at the edge of a regional conflict it did not choose and did not enter. Four lives were lost. Airspace closed. The Strait of Hormuz fell to near-zero traffic. The DFM real estate index dropped 32% in two weeks.
We are writing this on Day 16. The situation remains live and uncertain. What follows is not an attempt to minimize these realities. It is an attempt to analyze them with the precision that this moment demands, at a time when most commentary has chosen noise over rigor.
———————————
The DFM Real Estate Sector Index fell 32% in the two weeks following February 28. Emaar dropped 17.7% in a single week. For many observers, this is the story of UAE real estate in 2026.
It is not.
The historical correlation between Emaar's listed price and physical prime residential values in Dubai is approximately 0.3 to 0.4 over ten-year periods. Listed real estate trades on intraday sentiment, institutional repositioning, and margin calls. Physical property trades on fundamentals: supply, demand, migration, leverage, and income. These are different markets. Conflating them produces systematically wrong conclusions.
Three structural facts defined where UAE real estate stood when the conflict began. They have not changed.
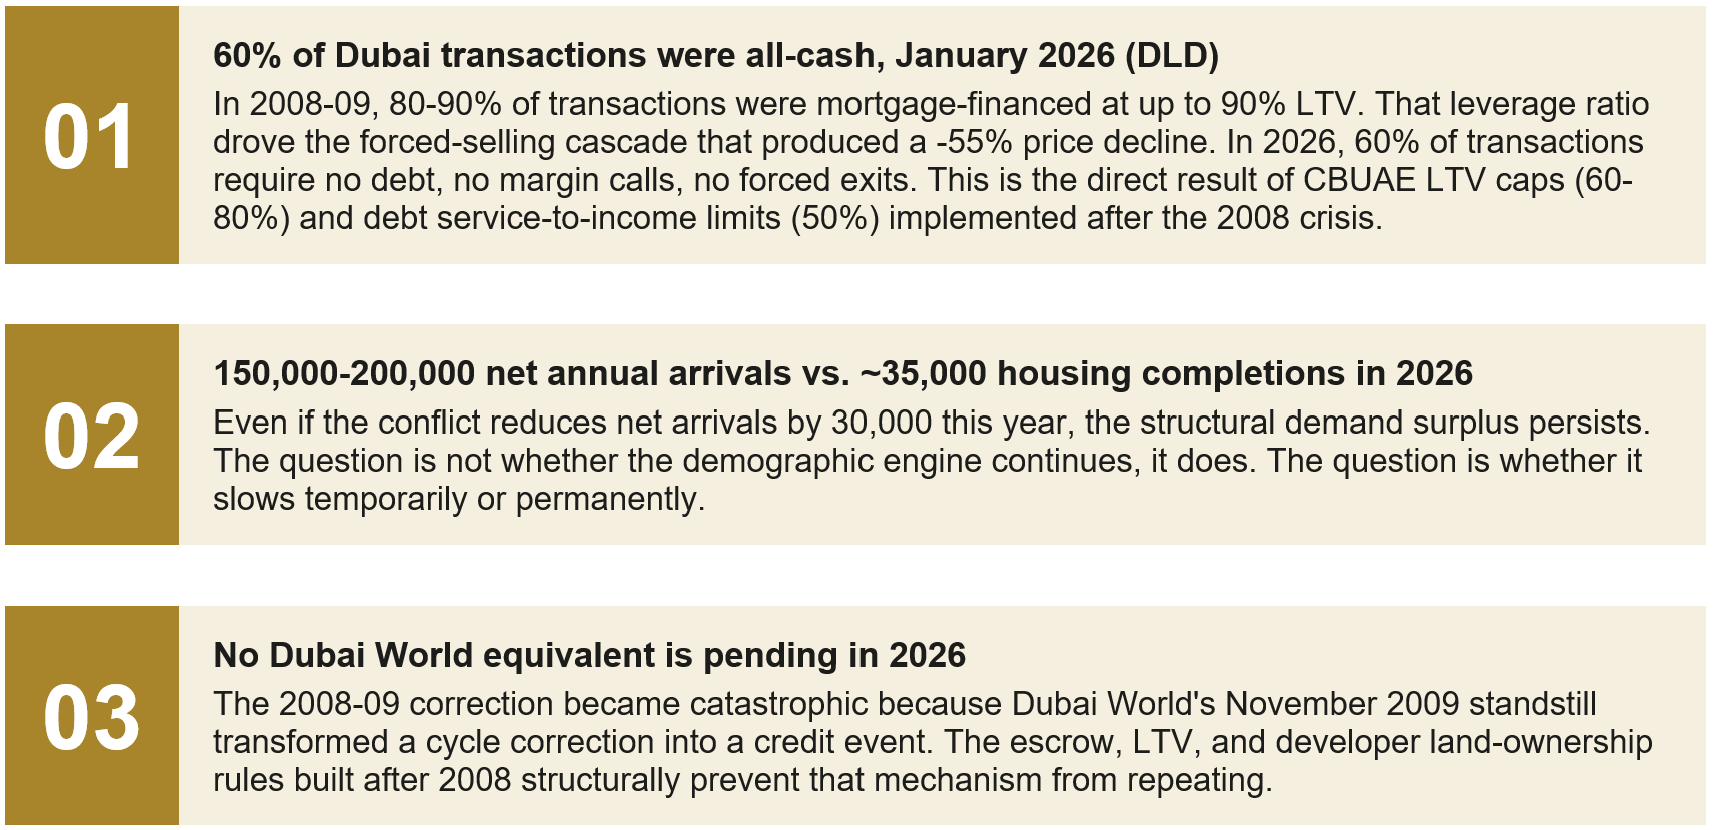
The Counterintuitive Finding
During the conflict, the market paradoxically remains in surplus deficit.
Here is what the supply-demand data actually shows, and what almost no current commentary has captured. During the conflict, supply and demand compress simultaneously. Construction slows due to Hormuz supply chain disruption, 8 to 12% construction cost inflation and material delays. Migration decelerates. But because both sides of the equation contract together, the market remains in structural deficit under all three conflict scenarios.
The Fitch pre-conflict oversupply projection of 120,000 units delivered in 2026 is eliminated entirely. Even under the most optimistic scenario, a short resolution of 4 to 6 weeks, only approximately 30,000 units will be delivered in 2026.
The real risk does not materialize during the conflict. It materializes after it.
When the frozen pipeline restarts, construction catch-up happens faster than migration recovery. This temporal mismatch is the precise mechanism through which oversupply can emerge in Dubai under a prolonged conflict. Under S2 (35% probability, 3 to 6 months duration), the absorption ratio reaches a fragile 1.01x at Year 2 post-conflict. Under S3 (15% probability, 6+ months), it falls to 0.85x at Year 1: outright oversupply, driven not by a supply surge but by structural demand destruction.
Abu Dhabi tells a categorically different story. Under every scenario, at every time horizon, the absorption ratio never falls below 2.0x, even in the most severe tail risk scenario, two years after conflict resolution. The pipeline is structurally too small to generate oversupply at any realistic demand level.
The Number That Matters:
2.0x
Abu Dhabi Minimum Absorption Ratio - All Scenarios
What it is:
Abu Dhabi's minimum demand-to-supply absorption ratio across all conflict scenarios and all-time horizons, including the most severe tail risk scenario, two years post-conflict.
What it does not say:
This figure does not imply Abu Dhabi is immune to sentiment effects or short-term transaction compression. The ADX General Index fell 5.7% following February 28.
What it truly reveals:
A structural housing shortage so deep that even a prolonged conflict causing a 60% reduction in net migration cannot generate oversupply. At 2.0x, demand still exceeds supply by a factor of two under the worst scenario at the furthest horizon modeled.
One Chart:
Where the Real Risk Actually Sits
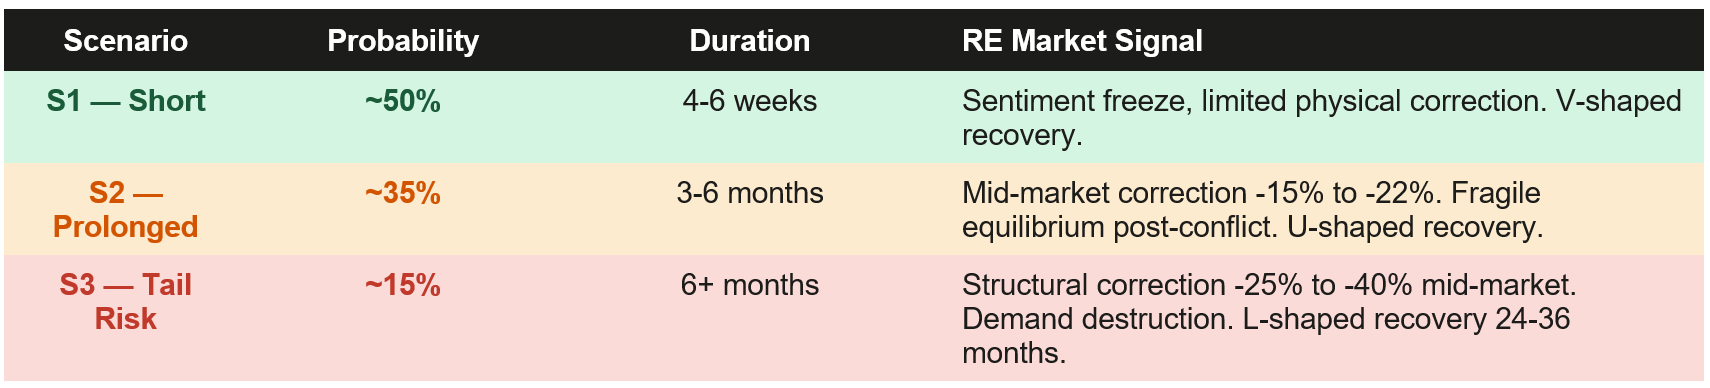
Probability weights: Allianz Research (March 3, 2026) and Oxford Economics (March 10, 2026). Conflict duration, not intensity, is the primary variable.
Absorption ratios by scenario and time horizon
Dubai & Abu Dhabi - Absorption Ratio by Conflict Scenario and Time Horizon | March 2026
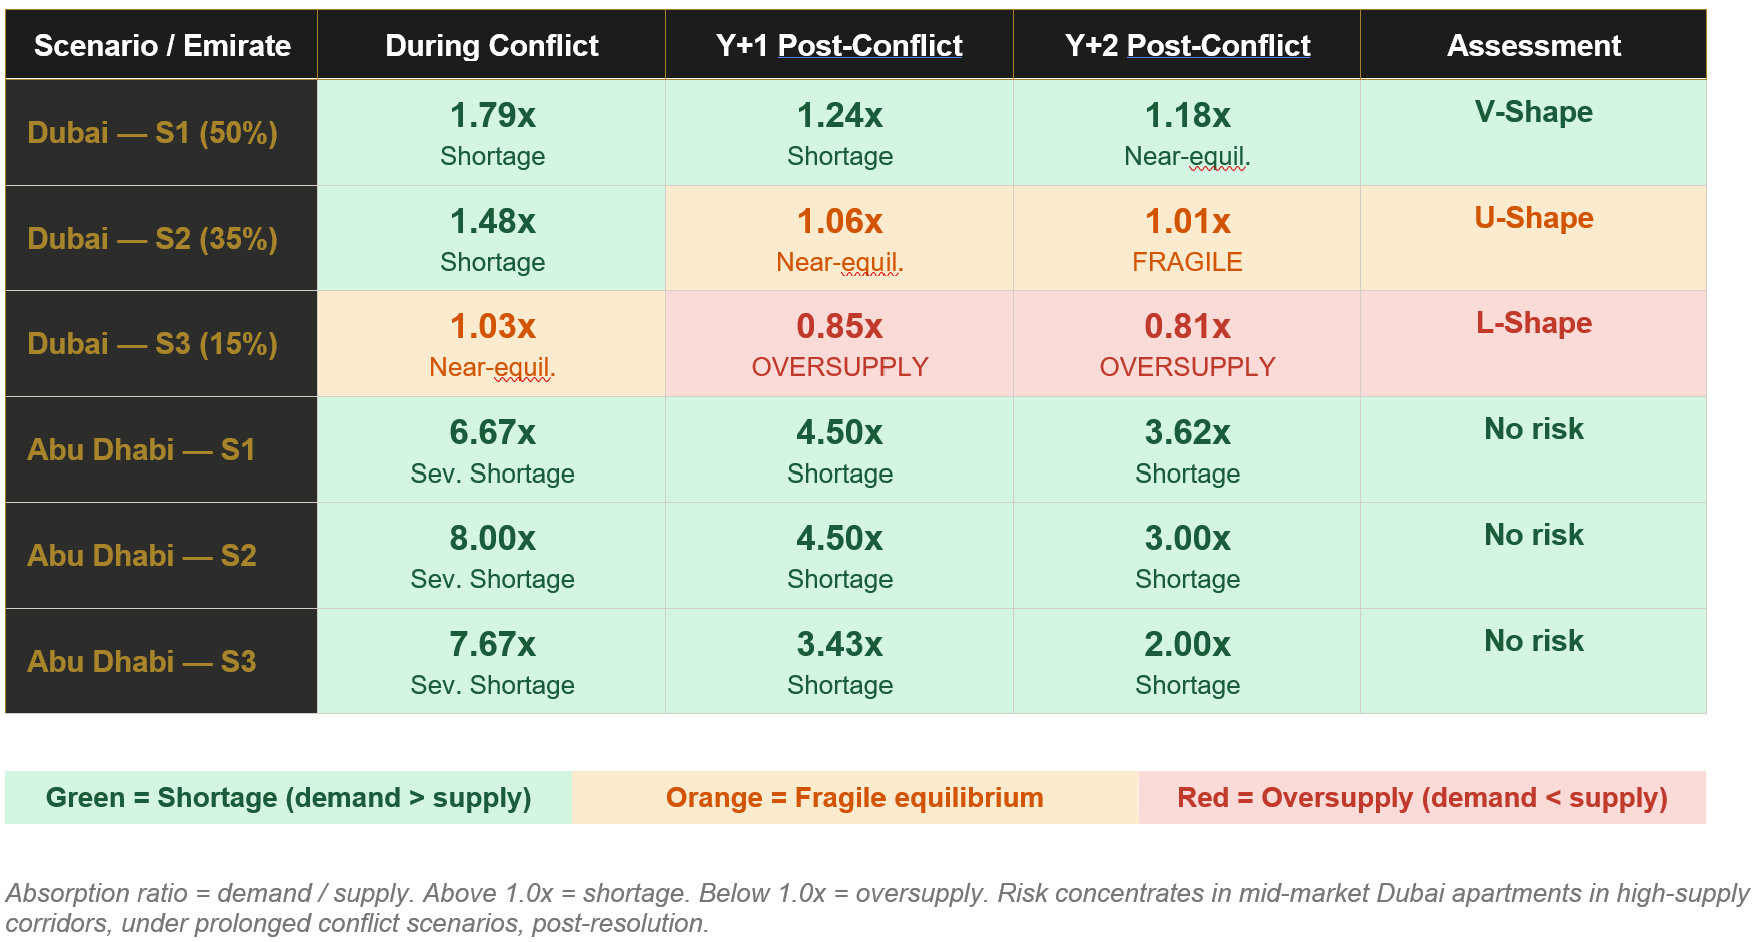
Sources: Knight Frank; Cavendish Maxwell; DLD; Oxford Economics (March 10, 2026); Allianz Reesearch (March 3, 2026)
What Yields Are Actually Saying
The after-tax income advantage widens precisely during global volatility.
In periods of acute geopolitical stress, income-generating assets with structural demand floors and zero capital gains tax are precisely the instruments that institutional capital historically rotates toward. The table below contextualizes UAE yields against major global alternatives.
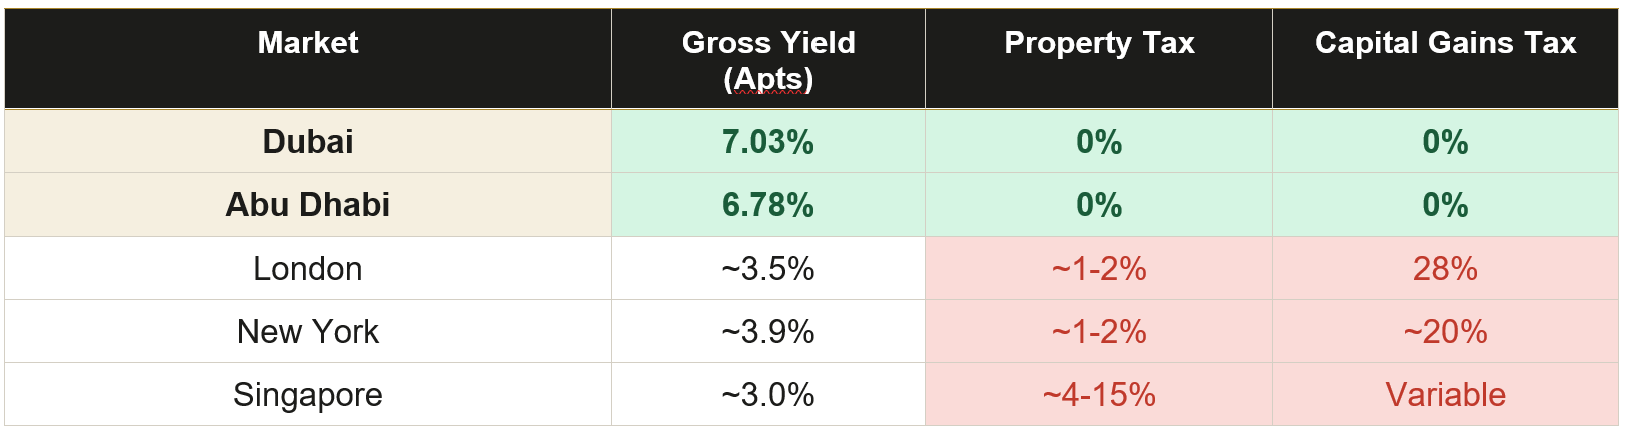
Sources: REIDIN December 2025; Global Property Guide November 2025; Knight Franck Global Cities 2026
This after-tax income advantage is structural, not cyclical. It widens in periods of global volatility, precisely when investors are repricing liquidity and income stability. Allianz Research (March 2026) confirms that real estate and infrastructure historically outperform equities and global fixed income during high-inflation, oil-shock environments.
Focus Zone
Abu Dhabi: A Structural Case in a Live Stress Test
Abu Dhabi entered this conflict from a structurally different position than Dubai. Its residential pipeline of 33,074 units through 2029 represents roughly one-fifth of Dubai's 302,880-unit backlog. Aldar Properties, controlling 32% of the Abu Dhabi residential market with an investment-grade balance sheet, provides execution certainty that smaller developers cannot replicate.
Residential demand is predominantly end-user driven, supported by employment density, government-linked corporate tenancies, and a population that reached 4.14 million in 2024, growing at 7.5% year-on-year (SCAD). Freehold access, opened to foreign buyers in 2019, has progressively broadened the structural buyer base.
Key point to monitor: In Abu Dhabi, the investment case does not depend on conflict resolution timing. It holds under S1, S2, and S3, at every time horizon modeled. The structural shortage cannot be resolved by a pipeline of this size, regardless of what happens to migration in the short term. Even in the most adverse scenario two years post-conflict, demand exceeds supply by a factor of two.
The Watch Variable
Post-ceasefire migration, not transaction volume
The variable that will determine which scenario plays out is not listed equity performance, not transaction volume, and not media sentiment. It is net annual migration in the 12 months following conflict resolution. Below 120,000 arrivals per year signals S2 dynamics. Below 80,000 signals S3 structural demand destruction.
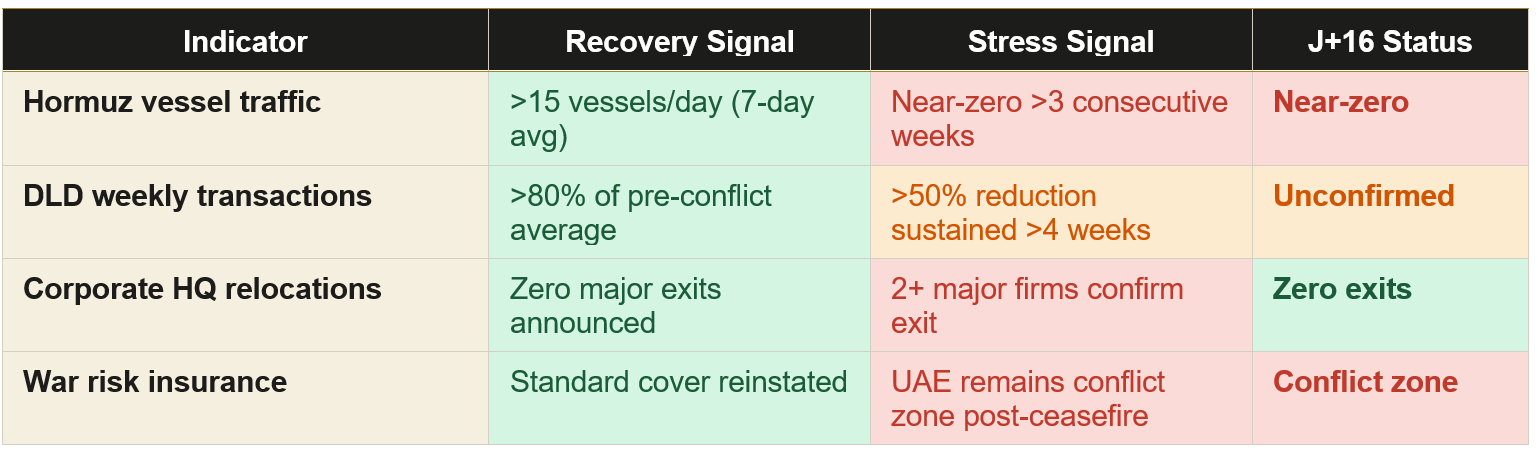
The conflict is 16 days old. Physical market data lags listed equity by 4-8 weeks. The data that will determine the severity of any correction does not fully exist yet. This framework provides the analytical structure; the facts will fill it in over the coming weeks.
Conclusion
The UAE real estate market is not the DFM RE Index. The conflict is real, the risks are material, and the uncertainty is genuine. But the market being stress-tested in March 2026 is categorically different from the one that fell 55% in 2008-09: lower leverage, structural demand surplus, no systemic credit event on the horizon, and yields that remain among the highest of any major real estate market globally.
Investors who understand that difference will be positioned correctly. Those who conflate a listed equity sell-off with a physical asset implosion will not.