
The Countercyclical State: What Sovereign Capital Did While Everyone Was Watching the DFM
Qasr Al Hosn, Abu Dhabi
Newsletter 04
EDITORIAL
On March 10, 2026, eleven days into an active regional conflict, two transactions totalling several billion dollars were announced within hours of each other. One involved a $1 trillion sovereign wealth fund. The other, a newly formed $237 billion financial holding company acquiring a majority stake in a firm that counts SpaceX, OpenAI and Anthropic among its portfolio companies.
Neither deal was defensive. Both had been structured over months. Both were executed at full speed. Over the following six weeks, more than $12 billion in institutional transactions involving the UAE were signed, structured and announced publicly. Understanding why requires looking beyond sentiment and into the architecture of the state itself.
———
The Signal the Market Missed
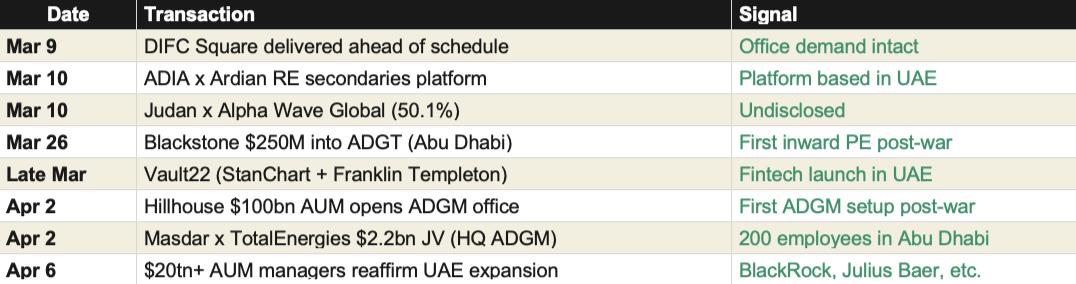
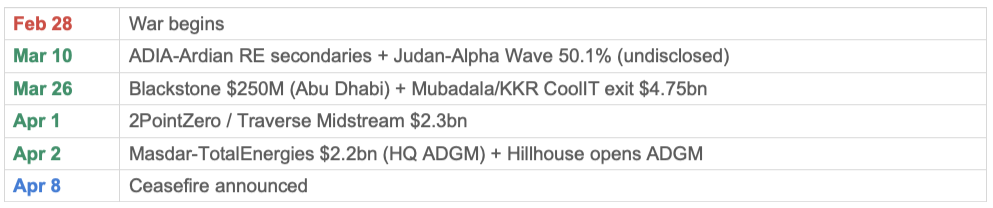
On March 26, 2026, four weeks into an active war, Blackstone committed $250 million to a new payments infrastructure platform based in Abu Dhabi. It was the first inward private equity investment into the UAE since the start of the conflict. The same week, Vault22, an AI-powered wealth platform backed by Standard Chartered Ventures and Franklin Templeton, launched its operations in the UAE.
These were not isolated events. On March 10, ADIA and Ardian announced a dedicated real estate secondaries platform. On April 2, two announcements landed on the same day: Masdar and TotalEnergies signed a $2.2 billion joint venture to consolidate onshore renewable energy assets across nine Asian countries, headquartered at Abu Dhabi Global Market with approximately 200 employees. And Hillhouse Investment Management, a Singapore-based alternative asset manager with $100 billion in assets under management, opened an office at ADGM after securing a Category 3C license from the FSRA. Hillhouse was described as one of the first firms to establish a new base in Abu Dhabi's financial center since the war began. The firm had already invested in UAE-based businesses, including Virtuzone, Hartland International School, and North London Collegiate School.
On April 6, The National reported that global asset managers with more than $20 trillion in assets under management had publicly reaffirmed their commitment to the UAE and were actively expanding regional operations. BlackRock confirmed the Middle East remains a core strategic priority, and its commitment is unchanged. Julius Baer, Lombard Odier, and Mirabaud each stated on record that their UAE presence was long-term. Several firms confirmed they were recruiting additional staff in their Dubai and Abu Dhabi offices during the conflict.
On the infrastructure side, DIFC Square was delivered ahead of schedule on March 9, citing exceptional demand from new international firms. DIFC has announced plans to deliver 1.6 million square feet of additional commercial space in 2026 and 2027.
Capital continued to enter the country while commentary questioned whether it would leave.
Simultaneously, UAE sovereign entities continued to deploy globally, executing over $9 billion in outbound transactions during the same period, including Mubadala and KKR's $4.75 billion exit of CoolIT Systems, Judan's majority acquisition of Alpha Wave Global, and 2PointZero's $2.3 billion purchase of a US gas pipeline operator.
Inbound Deal Tracker: February 28 to April 13, 2026
The Architecture Behind the Confidence
The institutional response was not improvised. It followed a structured, three-layered countercyclical framework deployed in under 30 days.
The first layer was monetary. The UAE Central Bank activated a five-pillar resilience package designed to support liquidity, ease regulatory constraints on capital buffers, and ensure continued credit flow through the banking system. This intervention served as a lender of last resort, preventing any tightening of lending conditions during the conflict.
The second layer was fiscal. Dubai approved an AED 1 billion economic support package, effective April 1, covering a three-month deferral of government fees, a full waiver of the Tourism Dirham, extended customs data grace periods, and streamlined residency renewal procedures. The package was designed to maintain operational cash flow for businesses while reducing administrative friction for employers managing international workforces.
The third layer was regulatory. The DIFC and DFSA unveiled time-limited flexibility measures covering licensing, governance, reporting, and supervision timelines for financial firms operating in the free zone. These measures were calibrated to be risk-based and proportionate, maintaining regulatory standards while acknowledging operational disruption.
The Debt Market Verdict
Bond markets price sovereign risk with precision. Two data points define the debt market's assessment of the UAE during this conflict.
On February 26, one day before the war began, Abu Dhabi raised $3 billion from a dual-tranche dollar bond sale. Orders peaked at $12.7 billion, and final pricing came in 30 basis points tighter than initial guidance. The market was competing to lend to the UAE at the lowest possible spread.
On April 9, during the fragile ceasefire, Abu Dhabi and Qatar placed billions of dollars through private bond sales arranged by Standard Chartered. Abu Dhabi alone raised $2.5 billion by reopening existing 2029 and 2034 bonds. Sovereign issuers accessing capital markets on their own terms, during an active conflict, without concession.
S&P Global Ratings reaffirmed the UAE's AA/A-1+ rating with a stable outlook on March 6, noting a consolidated net asset position of approximately 184% of GDP and government liquid assets of roughly 210% of GDP. These are among the strongest fiscal buffers of any rated sovereign globally.
What We Know, What We Don't, and What to Watch
Several commentators have cited Q1 2026 transaction data as evidence that the market is unaffected by the conflict. Dubai recorded AED 252 billion in real estate transactions in Q1, up 31% year on year. Abu Dhabi recorded AED 66 billion, up 160.7%. These are record figures. They are also misleading if read as a measure of conflict resilience.
A residential property transaction in the UAE takes between 3 weeks and 3 months from agreement to DLD registration. Q1 includes all of January and February, two months of pre-war momentum that were already on track for record performance. Even most of the March DLD registrations reflect deals agreed before February 28. The first transactions that genuinely capture post-conflict purchase decisions will not appear in official registers until May or June 2026.
In the first twelve days of March, transaction volumes fell 37% year on year and 49% compared to February. This contraction was partly operational, as government offices, developer sales centers, and brokerage firms closed during the first week. The second week of March saw a 51% rebound in transaction value. By the last week of March, weekly volumes had stabilized at AED 8.66 billion. These weekly patterns are informative, but they remain a mix of pre-conflict pipeline and early conflict activity. Drawing definitive conclusions from them would be premature.
What we can measure in real time is rental demand. Lease contracts in the UAE operate on an annual cycle. A lease signed or renewed in March 2026 reflects a decision made at that time. The Abu Dhabi repeat lease price index recorded a 16% annual increase in March 2026 compared to March 2025, according to the Abu Dhabi Real Estate Center. This is real-time confirmation that end-user demand, the demographic engine identified in Newsletter 01, continued to operate during the conflict.
What remains to be seen is how the conflict affects new purchase decisions over the coming months. The variables that will determine the trajectory are known. Net annual migration is the primary demand driver: the threshold identified in Newsletter 03 remains 120,000 arrivals per year. Below that level, absorption pressure rises in high-delivery zones. Developer behavior is the secondary signal: C-grade developers are already offering direct discounts, B-grade developers are restructuring payment plans, while A-grade developers are holding prices. The divergence in developer behavior is itself a leading indicator of where selective pricing pressure will emerge first.
For allocators evaluating the UAE, the relevant question is not whether the Q1 data is strong. It is. The relevant question is what the T2 and T3 data will show once the pre-conflict pipeline has cleared and genuine post-conflict demand becomes measurable. The institutional signals (capital flows, debt markets, sovereign response) are positive. The verdict on the physical market is still being written.
The Number That Matters:
+16%
Abu Dhabi repeat lease price index, March 2026 vs. March 2025 (source: ADREC)
What it is: The annual increase in residential rents in Abu Dhabi, measured in March 2026, occurred during the active conflict. Unlike transaction data, which reflects a pipeline of decisions made weeks or months earlier, rental data captures demand in real time. Lease contracts in the UAE operate on annual cycles. A renewal or a new signature in March 2026 reflects a tenant decision made under full awareness of the geopolitical context.
What it does not say: This figure does not predict rental evolution for T2 or T3 2026. If the conflict persists and net migration declines significantly, rental pressure will eventually ease. +16% is a data point, not a forecast. It is also specific to Abu Dhabi, where supply constraints are more acute than in Dubai. Dubai's rental trajectory may follow a different pattern, particularly in high-delivery zones.
What it truly reveals: The structural demand pressure identified in Newsletter 01, driven by population growth, household formation, and expatriate permanence, persisted during the conflict. For any allocator evaluating a point of entry into UAE residential real estate, this number redefines the risk-return equation. If a conflict-driven correction materializes in transaction prices over the coming months, it will occur in a market where rents are growing at 16% annually. The mechanical result is an expansion of gross rental yields. The correction creates the entry point. The rental growth protects the income floor. The two dynamics are simultaneous, and they define the window.
——
Yield Sensitivity: What Different Scenarios Mean for Entry Pricing
The following matrix models the effective gross yield on a residential acquisition under different combinations of price correction, rental growth, and occupancy. It is designed as a decision framework that illustrates how the interaction among these three variables creates or destroys a point of entry.
Assumptions: Base asset priced at AED 1,000,000 with a current annual rent of AED 70,000 (7.0% gross yield). Occupancy assumptions are linked to the rental environment: when rents are rising, the landlord has pricing power, and occupancy remains high (95%); when the market is balanced, occupancy is at 90%; when rents decline, the tenant has negotiating power and occupancy drops to approximately 80%. These are gross yields before service charges, maintenance, management fees, and vacancy costs, which typically reduce the effective return by 150 to 200 basis points.
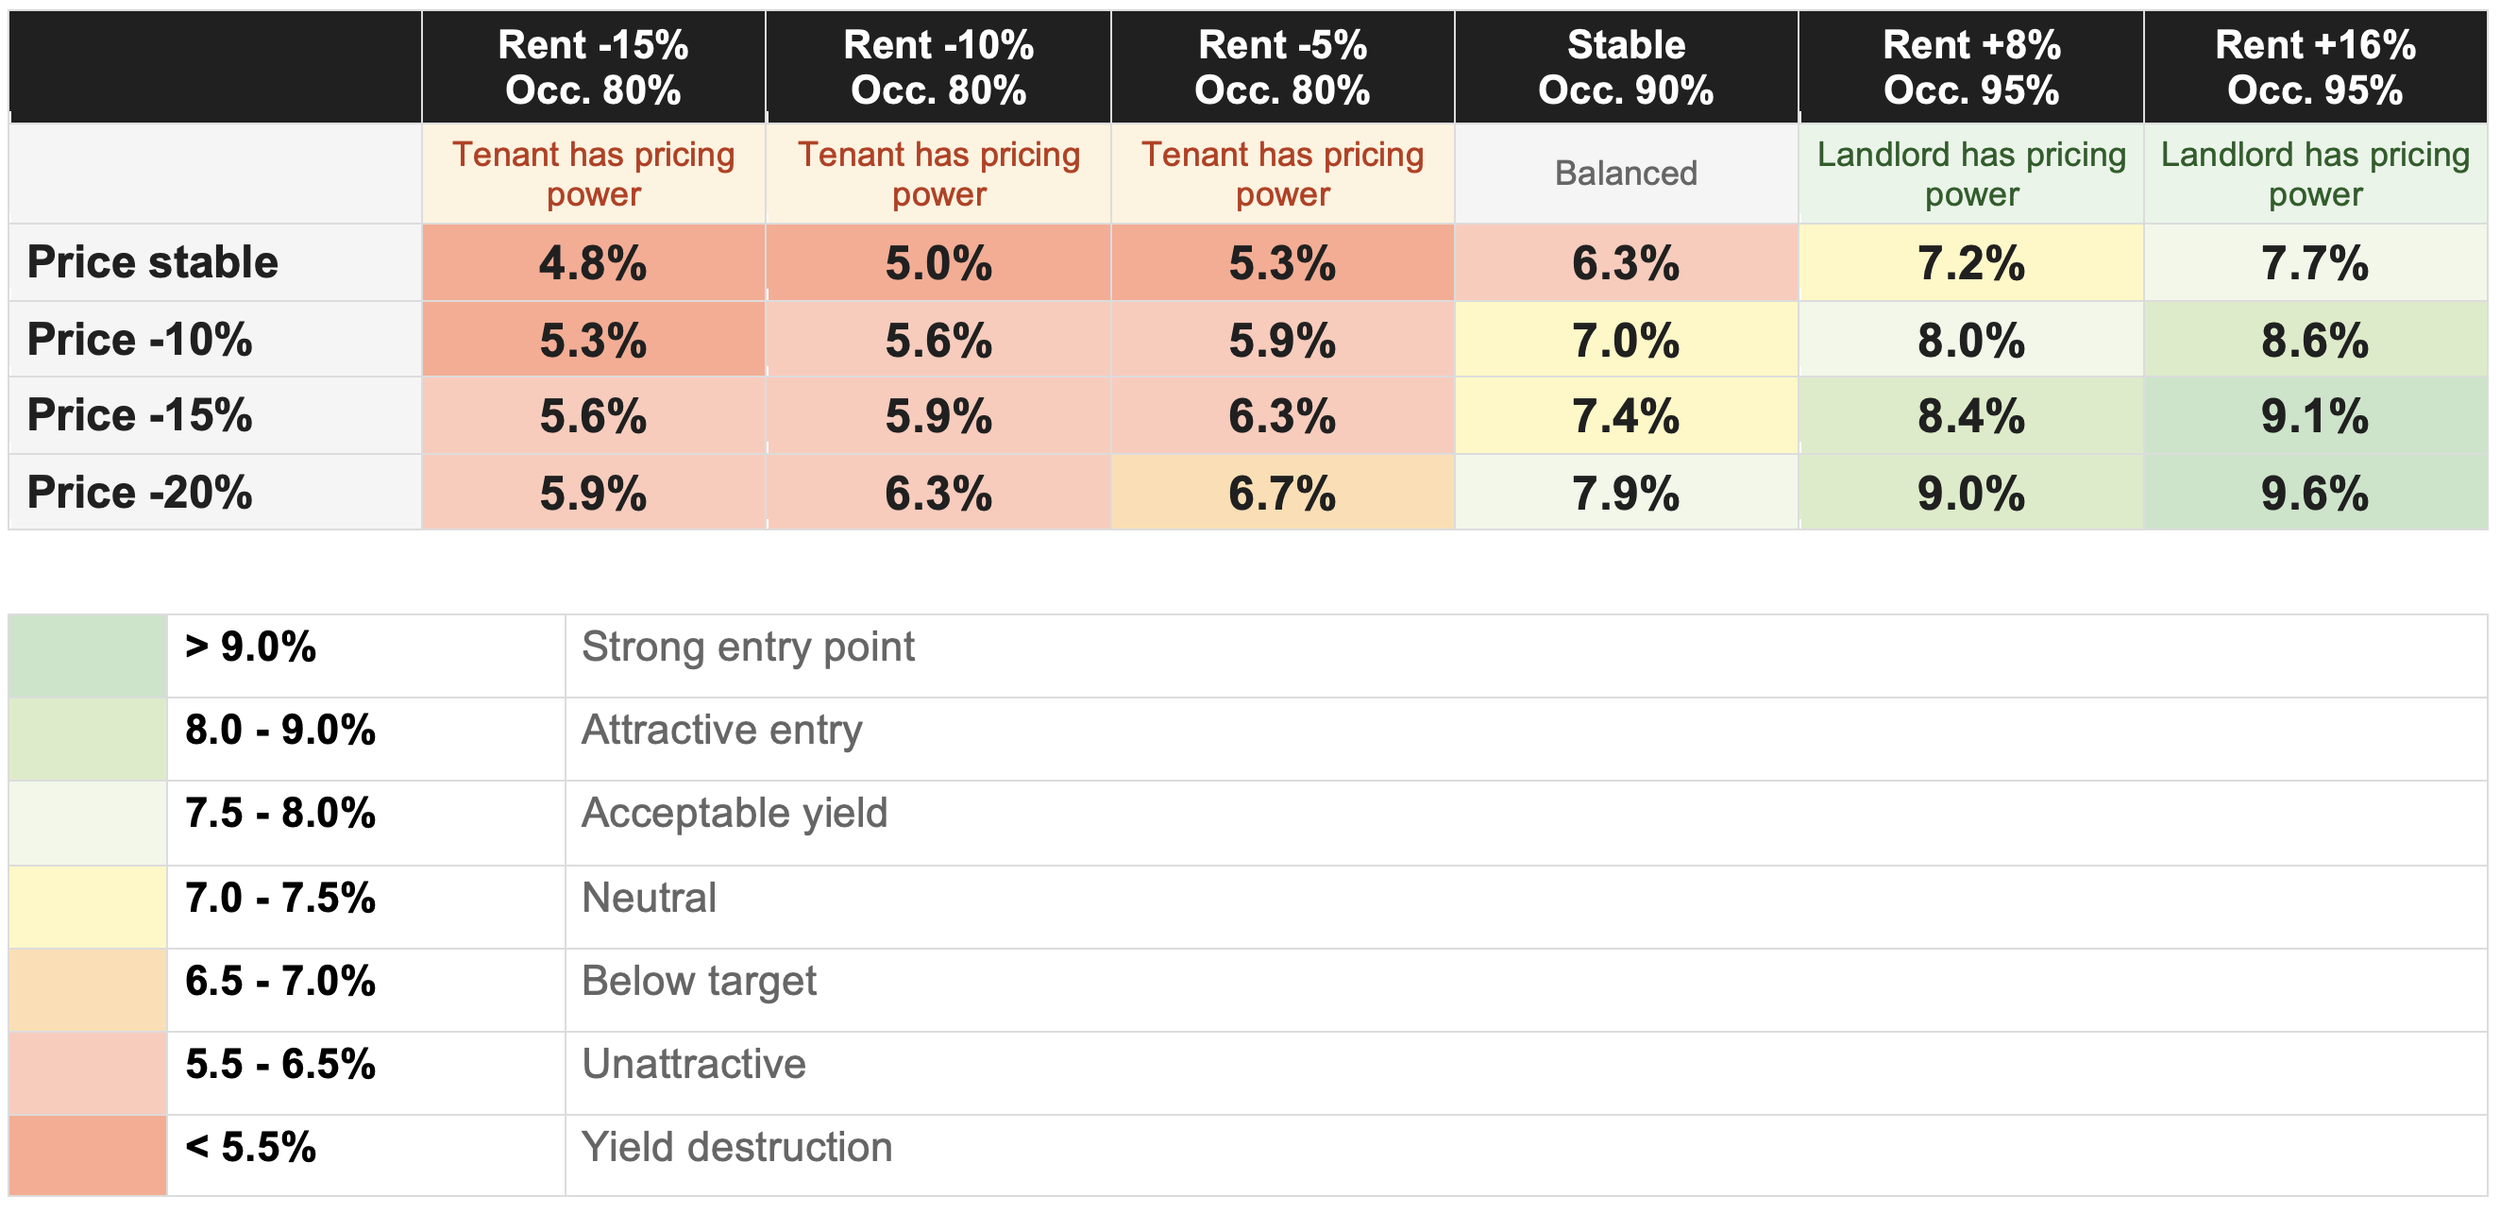
This matrix is provided for illustrative purposes only. It does not constitute a forecast, a recommendation, or an offer. Actual yields will depend on asset-level characteristics, location, tenant quality, and market conditions at the time of acquisition.
Reading the matrix: The lower-right quadrant (price correction combined with rental growth and high occupancy) represents the structural opportunity window: yields between 8.5% and 9.6% that are only available when prices correct faster than rents. The data from March 2026 (+16% rental growth in Abu Dhabi during an active conflict) suggests this type of environment may be forming. The upper-left quadrant (prices stable or gently declining while rents fall and occupancy drops) represents yield compression and capital risk. The diagonal, where prices and rents move in the same direction by similar magnitudes, produces marginal yield changes and no meaningful entry advantage.
The key determinant is timing. A price correction driven by sentiment (conflict, media, DFM index) while rental demand is sustained by employment and demographics creates a temporary yield expansion. That window closes when sentiment normalizes and transaction prices re-align with rental fundamentals. For allocators with capital available during this window, the matrix quantifies the opportunity. For those waiting for full data confirmation, the matrix illustrates what the entry point looks like once it has passed.
——
One Chart: What the Market Did vs. What Capital Did
DFM Real Estate Index performance vs. cumulative institutional deal value, February 28 to April 13, 2026
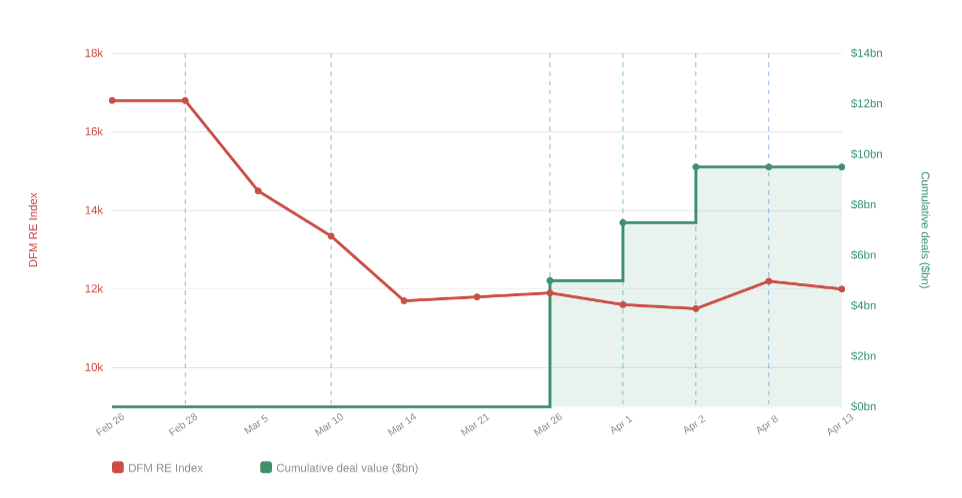
Reading: The red line tracks the DFM Real Estate Index, which fell 30% in six weeks as listed equity investors repriced risk. The green area tracks the cumulative value of institutional deals signed during the same period, rising from zero to $9.5 billion in disclosed value (estimated $12 billion+ including undisclosed transactions). The two curves move in opposite directions. One measured sentiment. The other measured conviction.
Deal timeline
Sources: Dubai Financial Market; Bloomberg; Ardian; Mubadala; IHC; Blackstone; TotalEnergies; Hillhouse; Bread Capital compilation, April 2026. DFM index values are approximate, sourced from financial press. Deal values are publicly disclosed amounts only.
——
Focus Zone
Meydan, Dubai: Structural Positioning vs. Pipeline Concentration
©Metropolitan
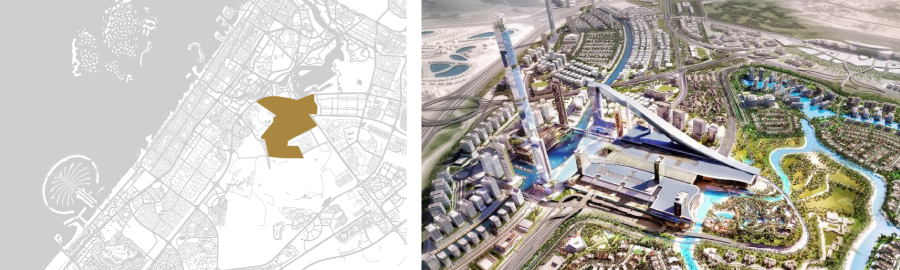
Meydan is positioned at the intersection of Dubai's established urban core and its next phase of expansion. Located adjacent to Downtown Dubai, Business Bay, DIFC, and Dubai Design District, the area sits within a corridor that is rapidly consolidating as the city's creative, commercial, and residential center of gravity shifts southward.
Price performance has reflected this positioning. Meydan City recorded the sharpest quarterly price increase of any Dubai community in Q3 2025: 22% quarter on quarter, equivalent to a 29% annual increase, according to Knight Frank. This outperformance exceeded that of Palm Jumeirah, Dubai Marina, and Downtown Dubai over the same period. Rental yields in the area range between 6% and 8%, supported by employment density in the adjacent DIFC and Business Bay corridors.
The investment case carries a structural tension that must be stated clearly.
On the demand side, the corridor's fundamentals are strong. Proximity to three major employment hubs (DIFC, Business Bay, d3), an expanding lifestyle infrastructure anchored by Meydan One (crystal lagoon, retractable-roof arena, residential towers), and an entry price point that remains competitive relative to Downtown create a demand profile driven by end-user professionals and long-term residents.
On the supply side, the pipeline is concentrated. More than 60 off-plan residential projects are listed in the Meydan area, with delivery windows spanning 2026 to 2028. MBR City, the broader area in which Meydan sits, is explicitly identified by several analysts as a high-pipeline-risk area. This supply volume, if delivered on schedule, would test absorption capacity.
The mitigating factor is historical delivery rates. Across Dubai, the materialization rate for projected completions was 41.3% in Q3 2025. For 2026, out of 71,613 units projected city-wide, only approximately 34,740 are expected actually to be delivered, a rate of 48%. This gap between announced and actual supply has historically prevented the oversupply scenarios that headline pipeline numbers suggest.
The variable that will determine whether Meydan absorbs its pipeline is the same one that determines the broader market's trajectory: net migration. If the post-conflict recovery follows the base case (conflict resolution within the ceasefire window, migration resuming above 120,000 arrivals per year), Meydan's positioning in Dubai's highest-growth corridor supports sustained absorption. If migration recovery is slower (the prolonged scenario from Newsletter 03), the concentration of deliveries in this zone becomes the primary risk factor.
Key point to monitor: Developer behavior within Meydan over the next two quarters. A-grade developers are holding prices, while C-grade developers are offering discounts, which is the current pattern across Dubai. If that divergence deepens specifically within Meydan, it will create selective acquisition opportunities at yields that were structurally unavailable six months ago. For a disciplined buyer with a rental-income strategy, the combination of a price correction and a +16% rental-growth environment is the definition of a window.
Conclusion
During the six weeks between February 28 and April 13, 2026, the UAE absorbed missile strikes, a 30% equity index correction, and a near-total shutdown of the Strait of Hormuz. During those same six weeks, Blackstone deployed its first post-war investment into Abu Dhabi, Hillhouse opened an ADGM office with a $100 billion platform behind it, global asset managers managing $20 trillion reaffirmed their regional expansion plans, Abu Dhabi raised $5.5 billion in sovereign debt without concession, and rents in Abu Dhabi grew 16% year on year.
The transaction data most commentators cite as proof of resilience reflects a pre-conflict pipeline. The real test will come in Q2 and Q3 2026, when post-conflict purchase decisions begin to appear in DLD registers. The institutional signals are clear. The verdict on the physical market is still pending.
The Central Bank had activated its resilience package within days. Dubai's stimulus was operational by April 1. The DFSA had published its relief measures by April 9. S&P reaffirmed AA/A-1+ on March 6. Each layer responded within weeks, not months.
—
This publication is provided for informational and educational purposes only. It reflects Bread Capital's interpretation of publicly available data and market observations and does not constitute investment advice, an offer, or a solicitation
