
The Three Scenarios, 73 Days Later
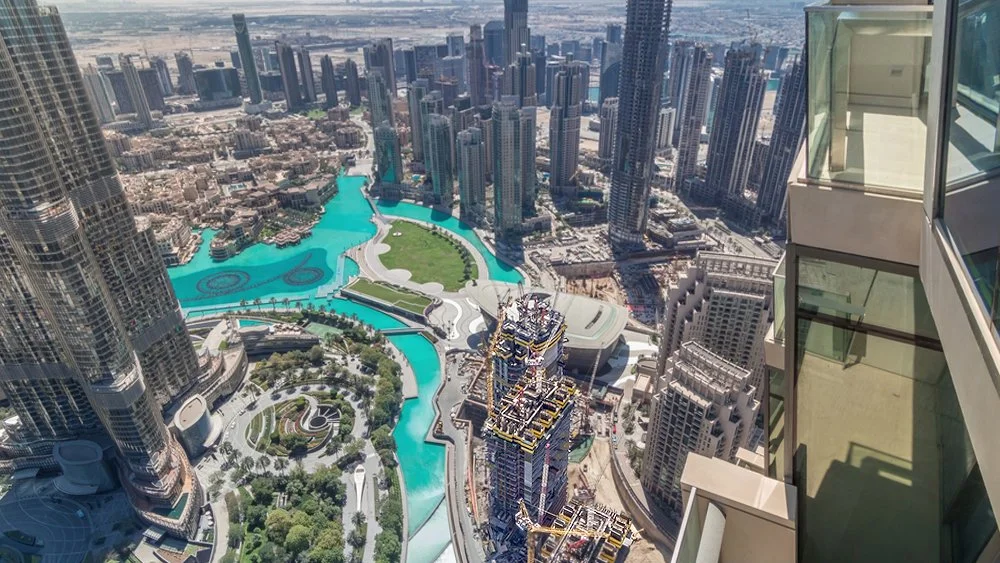
Dubai, UAE
Newsletter 05
Why headline recovery is not scenario validation
EDITORIAL
Working base case at 12 May: S2 (U-shape, prolonged uncertainty), with S1 (V-shape) as the upside. The S3 tail risk has receded but is not closed.
In March 2026 we modelled three scenarios for UAE real estate under conflict conditions.
S1: rapid resolution, V-shape recovery, 50% probability.
S2: prolonged uncertainty, U-shape, 35%.
S3: tail risk, L-shape, 15%.
Seventy-three days later, the temptation is to read the headline numbers and call it S1. Dubai April transactions are up 20% year-on-year. UAE airspace fully reopened. Capital flows did not pause.
We resist that reading. Volume recovery is not scenario validation. April's transactions reflect decisions made before, during and shortly after the ceasefire. The rental indices published this month reflect leases signed up to twelve months earlier. The first data point that genuinely measures the post-conflict market will not arrive before T3 2026.
This edition states what the current data shows, and is explicit about what it does not yet tell us.-
Scenario Tracker Dashboard
In Newsletter #03 (March 2026) we identified five operational indicators to track in real time. We add to them the government countercyclical levers activated since 28 February. The table below shows where each variable sits today, against the recovery and stress thresholds defined when the conflict began.
One observation up front. Volume indicators (transactions, airspace, capital flows) have returned to S1 territory, but structural indicators (secondary market, mortgage tightening, data lag) remain consistent with S2. The two will not reconcile before T3 2026, which is why our working base case sits at S2.
Methodology note on temporal lag. Dubai property registration runs three weeks to three months from sale agreement to DLD entry. This temporal lag applies uniformly to all DLD-derived figures below, including the pre-conflict baseline. The January 2026 baseline (AED 72.4 bn / ~16.8 bn weekly) reflects buyer decisions taken broadly between October and December 2025. The April 2026 figure (AED 68.56 bn) reflects decisions taken broadly between mid-January and end-March 2026, spanning pre-conflict, during-conflict and immediate post-ceasefire windows. The first DLD month reflecting purely post-conflict decisions will not appear before late June 2026. Rental indices are subject to the same lag plus a right-censoring constraint: at 12 May 2026, approximately 20% of Dubai’s annual lease stock has had its renewal anniversary since 28 February; the remaining ~80% remain under pre-conflict contracts. Headline rental stability is observed on a partial sub-sample, not on the full market.
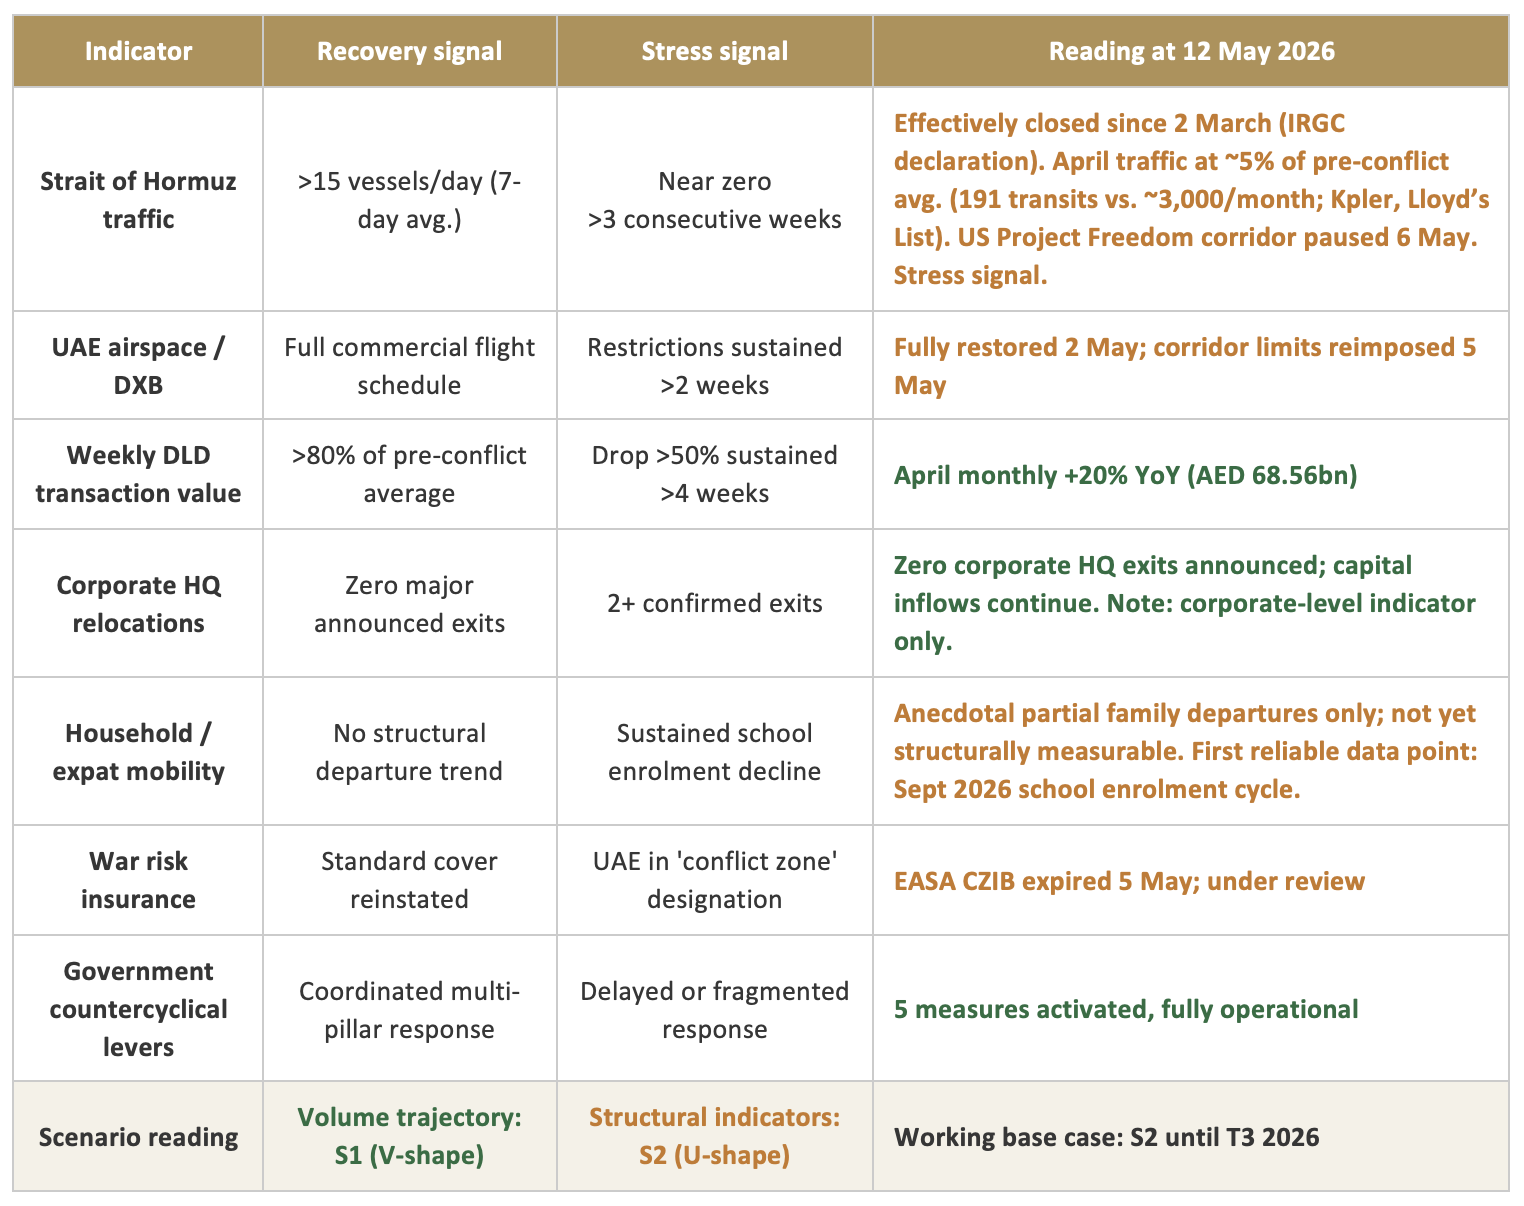
Five government measures activated since 28 February, all sourced and operational:
1. CBUAE Five-Pillar Financial Institution Resilience Package, approved 17 March 2026, backed by AED 1 trillion in reserves. As of 1 May, 60,559 individuals, 4,335 SMEs and 485 corporates have drawn AED 6.2 billion in support. Banking sector loans grew 3.2% over the conflict period.
2. Dubai AED 1 billion economic support package, effective 1 April 2026 (fee deferrals, Tourism Dirham waiver, customs grace periods, streamlined residency renewals).
3. DFSA time-limited flexibility measures on licensing, governance, reporting and supervision timelines, published 9 April 2026.
4. DLD removal of the AED 750,000 minimum property value for the two-year Taskeen investor visa, effective 29 April 2026. The AED 400,000-750,000 segment represented approximately 24% of Q1 2026 ready-home transactions and was previously visa-ineligible.
5. UAE formal exit from OPEC and OPEC+, effective 1 May 2026, allowing full production capacity recovery as the Strait of Hormuz situation normalises.
The Number That Matters
+20%
Dubai April 2026
transaction value YoY
What it is: Dubai recorded AED 68.56 billion in total real estate transaction value in April 2026, a 20% increase versus April 2025. This is the first full calendar month following the 8 April ceasefire.
What it does not say: It does not measure post-conflict purchase decisions. As detailed in the Methodology Note above, the April figure reflects a window of decisions taken broadly mid-January to end-March 2026. The first DLD month genuinely reflecting post-conflict buyer behaviour will not appear before late June or July 2026.
What it truly reveals: Demand inertia is intact. Buyers who had committed before or during the conflict followed through. The primary market grew 18% YoY, off-plan primary 20%. Dubai rental contract volumes are up 16% YoY. The Abu Dhabi repeat lease index is at +16% YoY through March (ADREC). The income side of the equation is stable. The reservations are equally measurable. Dubai's secondary market contracted 34% YoY in April. Seven mortgage lenders cut maximum LTV from 80% to 70% during the conflict and have not reversed. Headline volumes look V-shape. The texture underneath looks U-shape.
Sources: DLD via Dubai Media Office; Property Finder; Mortgage Finder; ADREC.
One Chart
Dubai weekly transaction value vs. the three scenario bands defined in Newsletter #03
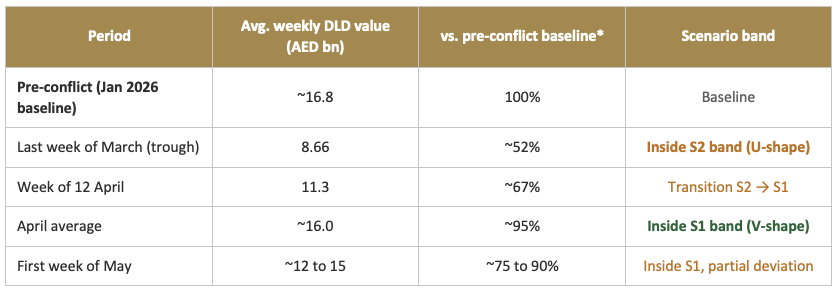
*Pre-conflict baseline derived from January 2026 monthly DLD value (AED 72.4bn) divided by 4.3 weeks. S1 band represents a V-shape recovery to >80% of baseline within six to eight weeks. S2 band represents a sustained trough at 50 to 65% of baseline for three to six months. S3 band represents L-shape with no recovery to 80%+ within twelve weeks. All figures in this table are subject to the temporal lag described in the Methodology Note above: the pre-conflict baseline reflects buyer decisions taken in Q4 2025, and the post-ceasefire figures reflect a mix of pre-conflict, during-conflict and immediate post-ceasefire decisions.
Reading: The volume trajectory has re-entered the S1 band on a headline basis. This is the most visible signal, and it is real. It is also incomplete. Three things qualify it. First, April transactions reflect decisions taken weeks earlier. The first DLD month of genuinely post-conflict decisions will not register before late June. Second, the Dubai secondary market contracted 34% YoY in April. A V-shape recovery reconciles primary and secondary. The current divergence is U-shape. Third, seven mortgage lenders cut maximum LTV from 80% to 70% during the conflict and have not reversed. Banks with access to real-time portfolio data are positioning for prolonged reduced visibility.
Honest read at 12 May 2026: volumes track S1, fundamentals track S2. S2 is our working base case until the two reconcile at T3 2026.
Focus Zone
Business Bay, Dubai
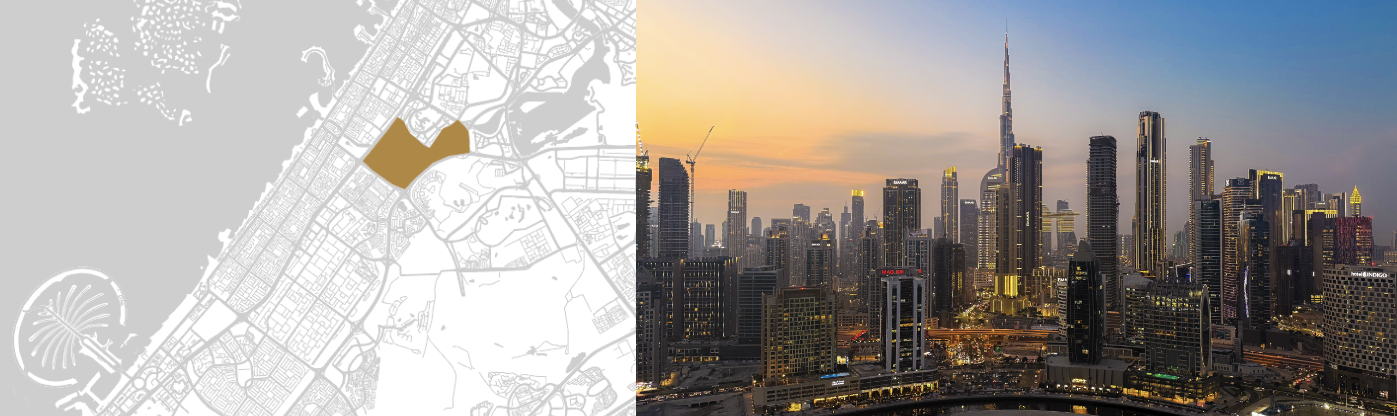
Business Bay enters the post-ceasefire phase as the most informative test case in Dubai. It sits at the intersection of three forces that capture the broader market's tension.
Demand fundamentals
Gross rental yields in Business Bay range between 6.5% and 8.5% on apartments (DLD transaction data Q1 2026, cross-referenced with rental index data). Proximity to DIFC, Downtown Dubai and the d3 corridor anchors corporate tenancy demand. Dubai's April off-plan office transactions reached a record monthly high of AED 3 billion, with Business Bay benefiting from spillover demand. The Bay Avenue retail ecosystem and metro connectivity provide structural occupancy support.
Rental data caveat
The 6.5-8.5% yield range above is based on Q1 2026 transaction prices and rental indices reflecting leases signed up to twelve months earlier. At J+73, approximately 20% of Business Bay’s annual lease stock has had its renewal anniversary since the start of the conflict on 28 February; the remaining ~80% are still under pre-conflict contracts. Rental stability is therefore observed on a partial sub-sample, not on the full rental stock. The first market-wide renewal cycle reflecting post-conflict landlord-tenant negotiations will not complete before Q1 2027. Until then, “rental stability” in Business Bay should be read as absence of repricing in the renewed sub-sample, not as a verified property of the full market.
Supply concentration
Business Bay carries one of the highest residential supply pipelines of any Dubai community, with more than 15,000 new units scheduled for delivery between 2026 and 2027 (independent estimates, April 2026). Business Today Middle East (May 2026) explicitly identifies Business Bay alongside Dubai Marina as the two micro-markets where late-2026 and early-2027 deliveries are most likely to test absorption capacity. Dubai-wide materialisation rates have historically run at approximately 41% of announced supply, which is the structural buffer.
Developer behaviour
The pattern documented in Newsletter #04 (A-grade developers holding prices, C-grade developers offering discounts and extended payment plans) is most visible here. Business Bay's concentration of mid-cycle developers makes it the first zone where divergent developer responses translate into price differentiation.
Key point to monitor
The ratio between secondary and primary market activity in Business Bay over the next two quarters. The Dubai-wide secondary market contracted 34% YoY in April, while off-plan primary grew 20%. This divergence is the single clearest U-shape signal in the current data. If Business Bay's secondary contraction continues or deepens, the entry point modelled in the Newsletter #04 sensitivity matrix begins to materialise here first. Rental yields holding at current levels while secondary transaction prices correct is the precise mechanical condition for yield expansion. We watch this micro-market as the leading indicator for the broader Dubai cycle.
Conclusion
At J+73, the data does not yet permit confident scenario assignment. Volumes tell one story. Fundamentals tell another. Three considerations anchor our working view that the current period is best read as S2.
First, data lag. The April +20% reflects a pipeline of decisions that pre-dated the ceasefire. The first DLD readings showing genuinely post-conflict purchase behaviour will not appear before T3 2026.
Second, rental ambiguity and right-censoring. The rental indices published in May reflect leases signed up to twelve months earlier. At J+73, approximately 20% of Dubai’s annual rental stock has had its renewal anniversary since the start of the conflict; the remaining ~80% remain under pre-conflict contracts. Reported rental stability is therefore observed on a partial sub-sample, not on the full market. If the short-term rental segment continues to feed conventional long-term supply, as documented in our March STR analysis, Dubai rents face downward pressure in the coming months. The Abu Dhabi repeat lease index at +16% YoY is a March 2026 reading. Its July counterpart, and the H2 2026 renewal cycle more broadly, will tell us whether the rental floor holds.
Third, lender behaviour. Seven mortgage providers cut LTV from 80% to 70% during the conflict and have not reversed. Banks with access to real-time data anticipate a period of reduced visibility. That is U-shape positioning, not V-shape.
A V-shape recovery remains possible. Headline volumes are consistent with it. Government policy support is consistent with it. But at J+73, the burden of proof falls on the V-shape thesis, not the U-shape. We hold S2 as the working base case until the data either confirms the V or anchors the U.
The next material readings are the H1 2026 ADREC and DLD releases, expected in July.
SOURCES: Dubai Land Department (Q1 2026 release, Dubai Media Office); Abu Dhabi Real Estate Centre Q1 2026 press release (7 April 2026); Central Bank of the UAE Financial Institution Resilience Package (17 March 2026) and update (8 May 2026, The National); DFSA flexibility measures (9 April 2026); ValuStrat UAE Q1 2026 Real Estate Review (10 May 2026); Mitchell's Commercial Realty Weekly Insights (2 May 2026); Edwards & Towers Dubai Real Estate Weekly Rundown (April-May 2026); Property Finder; Mortgage Finder; Khaleej Times (Taskeen visa update); Sherwoods Property; Gulf News (UAE relief measures, May 2026); Alvarez & Marsal (CBUAE Resilience Package analysis); Al Jazeera and Euronews (UAE airspace, 3 May 2026); Cirium (regional aviation data); Business Today Middle East (Q1 2026 supply pipeline analysis); REIDIN December 2025; S&P Global Ratings (UAE AA/A-1+ stable outlook, 6 March 2026).
This publication is provided for informational and educational purposes only. It reflects Bread Capital's interpretation of publicly available data and market observations and does not constitute investment advice, an offer, or a solicitation. The Coinvesting Bread Real Estate Fund L.P. is regulated by the DFSA in the DIFC, Dubai. Bread Capital Ltd, ADGM, Abu Dhabi. contact@bread-capital.ae | www.bread-capital.ae
